
This case study demonstrates how barcode-level retail analysis can support Fresh Produce assortment optimisation, supplier performance review, and waste reduction. The report focuses on Fresh Fruits and Vegetables performance across assortment movement, sales concentration, supplier dependency, and waste-risk behaviour
Executive Summary
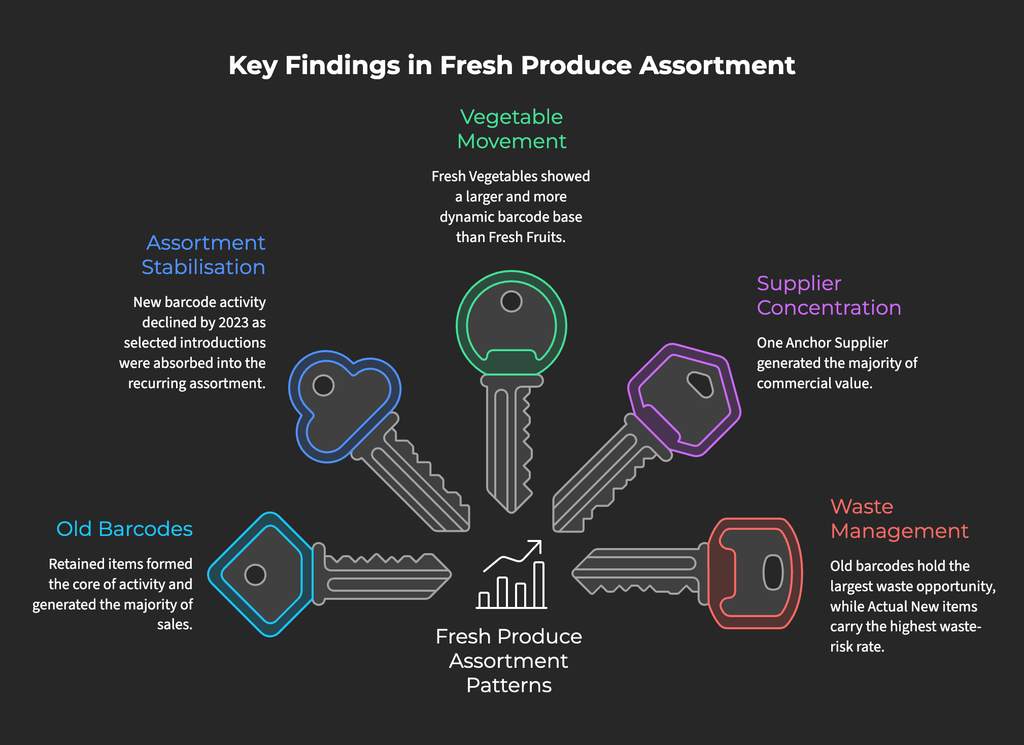
This report analyses Fresh Fruits and Vegetables at barcode level to assess assortment movement, supplier dependency, sales contribution, and waste risk. The analysis shows a clear shift from broad new-item expansion toward a more stable, commercially anchored assortment, with Old barcodes forming the core of barcode activity, sales performance, and waste exposure.
Old barcodes remained the commercial backbone of the category and offer the largest operational opportunity because of their scale. Waste reduction should therefore focus on forecasting, replenishment, stock rotation, and ordering discipline within the retained core range. At the same time, Actual New items carried the highest waste-risk rate on a per-barcode basis, requiring tighter launch controls, smaller trial quantities, and faster scale-or-discontinue decisions.
Family and supplier findings reinforce the need for focused category management. Fresh Vegetables showed stronger assortment movement, while Fresh Fruits remained more dependent on the core range and represented the larger share of remaining waste. Supplier sales were also highly concentrated around one Anchor Supplier, meaning future reviews should assess sales contribution, core-range support, waste behaviour, and dependency risk rather than item count alone. Overall, Fresh Produce optimisation should prioritise protecting the core range, reducing waste in high-scale retained items, managing new launches carefully, and strengthening supplier performance around commercially meaningful products.
Business Context
Fresh Produce is one of the most operationally sensitive areas within retail. Categories such as Fresh Fruits and Fresh Vegetables are affected by frequent assortment movement, short product life cycles, supplier dependency, seasonal availability, pricing fluctuations, and waste exposure. For retailers, managing this category effectively requires more than high-level sales reporting. It requires item-level and barcode-level visibility to understand which products are consistently supporting sales, which new items are being retained, which suppliers are driving the range, and where waste risk is concentrated.
This Retail Produce Analysis Report demonstrates how barcode-level analytics can be used to assess Fresh Fruits and Vegetables (F&V) performance across assortment, supplier contribution, sales dependency, and waste behaviour. By analysing barcode appearance categories-the report highlights how the assortment evolved over time and whether the category moved toward expansion or stabilisation.
The analysis also examines supplier concentration and waste risk, helping identify whether performance is driven by a broad supplier base or dependent on a smaller group of key suppliers. For retailers, these insights can support better category management, assortment optimisation, replenishment planning, supplier review, and waste reduction initiatives.
This case study showcases how data-led retail consultancy can convert historical product-level data into practical business insights for improving category performance and operational efficiency.
Objectives and Scope
The objective of this report is to assess F&V performance using barcode-level data to identify assortment movement, supplier dependency, sales contribution, and waste risk. The analysis aims to understand how the category evolved over time, which product groups formed the stable core assortment, which newer items were retained, and where waste-reduction opportunities are concentrated.
The scope of the report focuses on F&V categories across selected analysis periods between 2019 and 2023. The study uses cleaned barcode-level data to evaluate item count, sales contribution, supplier contribution, waste behaviour, and waste risk categories.
This report does not assess full store operations, customer behaviour, pricing strategy, or detailed profitability performance. Instead, it focuses on product-level assortment, supplier, sales, and waste patterns to support category optimisation and retail decision-making.
Methodology
Data Source and Period Covered
The analysis was developed using Fruit & Vegetable item-level data covering the years 2018 to 2023. The source files contained yearly product records, but there was no dedicated date column. To support year-based analysis, the original Dept field was renamed as Year so that each record could be clearly linked to its reporting year.
Initial Data Review
The original datasets varied in both record count and field structure across years. As part of the initial data review, the data was assessed for completeness, consistency, null values, zero-heavy distributions, and availability across the analysis period.
Fields with limited analytical value or inconsistent availability were reviewed and removed where required. This allowed the final analysis to be built on a cleaner and more comparable dataset suitable for barcode-level retail analysis.
Barcode-Level Standardisation
The analysis focused on barcode-level movement across years. Each year’s data was reviewed to understand the relationship between Bar Code, Item Code, and Item Name. The data review showed that each barcode was linked to a unique item code, and each item code was linked to a specific item.
Distinct barcode lists were then created for each year using PivotTables. This allowed barcode movement to be tracked across the 2018 to 2023 period.
Barcode Appearance Classification
The year 2018 was used as the base year for comparison. Barcodes from later years were classified based on whether they already existed in the base year, appeared for the first time, continued into later years, disappeared, or reappeared.
To support consistent analysis, barcode appearance categories were standardised into the following groups:
- Old
- Actual New
- Continued from First Appearance
- Reappeared Barcode
- Irregular
These categories were applied from 2020 onwards to support consistent year-on-year comparison.
Cleaning of Key Performance Metrics
Several key performance metrics were reviewed and cleaned to improve consistency across the analysis period. This included checking missing values, reviewing zero-heavy fields, and standardising selected percentage-based metrics used in the analysis.
Where original fields contained missing or inconsistent values, cleaned versions were created using available underlying data. This allowed the analysis to compare barcode-level performance more consistently across assortment movement, supplier contribution, sales contribution, and waste behaviour.
A cleaned waste percentage field was created to support the Waste Risk Matrix. This enabled barcode-level waste exposure to be grouped into waste bands and compared against sales contribution bands for risk classification.
Creation of Analysis Datasets
Multiple analysis datasets were created to support different levels of comparison and to account for differences in field availability across years.
The Final Dataset covers the period 2019 to 2023. This was created as the broadest aligned dataset because 2018 was used as the base year for barcode comparison, while 2019 to 2023 provided the usable analysis period for tracking barcode movement, sales, supplier contribution, and waste behaviour.
Separate focused datasets were also created for:
- 2020 to 2023 analysis
- 2021 to 2023 analysis
- 2022 to 2023 analysis
These shorter-period datasets were created because later years contained additional fields that were not consistently available in earlier years. This allowed the analysis to remain both consistent and flexible, using the widest possible time period where appropriate while also enabling more detailed analysis where field availability was stronger.
Family Category Scope
The report focused on the shared Fresh Fruits and Fresh Vegetables family categories. This ensured consistency across the selected years and allowed the analysis to remain focused on the core Fruit & Vegetable scope.
The cleaned data was then used to analyse:
- Barcode appearance trends
- Family category breakdown
- Supplier item-count contribution
- Supplier sales contribution
- Waste by family category
- Waste by barcode appearance category
- Waste risk categories
Waste Risk Matrix Method
A Waste Risk Matrix was created to classify barcode-level waste exposure.
First, Sales Share was calculated as:
Item Sales / Total Sales
Each item was then classified into a Sales Contribution Band:
- High Sales Contribution
- Medium Sales Contribution
- Low Sales Contribution
- No Sales / Insignificant
Waste was classified using Cleaned Waste % into:
- High Waste
- Medium Waste
- Low Waste
- No Waste
The final Waste Risk Category was created by combining the Sales Contribution Band and Waste Band. This allowed each barcode to be placed into an action-oriented risk segment.
Analytical Purpose
This methodology enabled the report to move beyond high-level sales reporting and assess F&V performance at barcode level. By combining barcode lifecycle classification, supplier contribution, sales share, waste behaviour, and risk categorisation, the analysis provides a structured view of assortment movement, supplier dependency, category stability, and waste-reduction opportunities.
Analysis Findings
1. Core assortment remained the commercial anchor
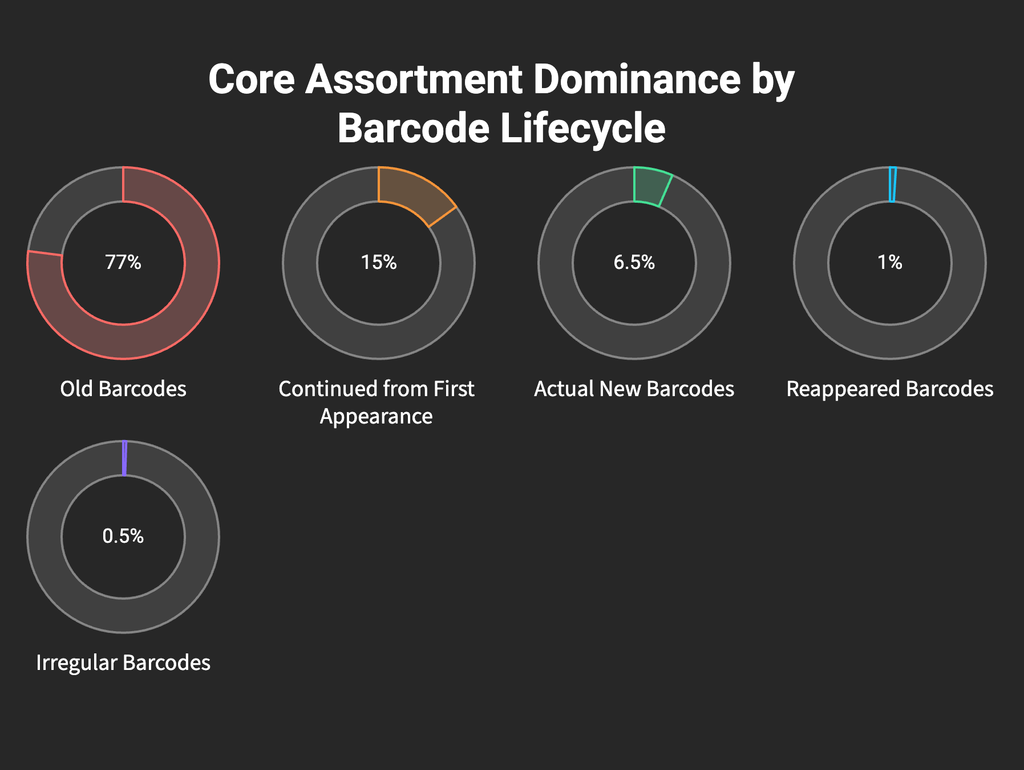
As shown in Figure 1: Core Assortment Dominance by Barcode Lifecycle, retained Old barcodes represented approximately 77% of total barcode activity across the 2019–2023 Final Dataset. This makes Old barcodes the dominant lifecycle group within the Fresh Fruits and Fresh Vegetables assortment.
This finding shows that the category was not primarily driven by continuous new-item introduction. Instead, its operational foundation was the established range: products with recurring demand, supplier familiarity, replenishment history, and customer recognition.
Figure 1: Core Assortment Dominance by Barcode Lifecycle
Based on Final Dataset, 2019-2023
The chart also shows that newer and less stable lifecycle groups formed a much smaller part of the assortment. Continued from First Appearance barcodes represented approximately 15% of barcode activity, while Actual New, Reappeared, and Irregular barcodes together represented less than 10%. This suggests that while new and evolving items were present, they did not define the overall structure of the category.
From a commercial perspective, the sales analysis further reinforces this point. Old barcodes did not only dominate barcode activity; they also generated the overwhelming majority of total sales. This confirms that the retained core range remained the main commercial engine of the Fresh Produce category.
2. The category shifted from expansion toward assortment stabilisation
The Fresh Fruits and Fresh Vegetables assortment moved away from active range expansion and toward a more stable category structure. This was reflected in the decline of Actual New barcode activity, while Continued from First Appearance items became more prominent over time.
From 2020 to 2023, Actual New barcode count share fell from 12.2% to 1.2%. Over the same period, Continued from First Appearance count share increased from 6.2% to 30.1%, while its sales share rose from 1.1% to 11.7%.
This indicates that selected post-base-year introductions were not merely short-term trial items. Instead, some were retained, absorbed into the recurring range, and became more commercially meaningful over time. In practical terms, the category appears to have shifted from broad new-item introduction toward selective retention and assortment stabilisation.
3. Fresh Vegetables showed stronger assortment movement than Fresh Fruits
Fresh Vegetables had a larger and more dynamic barcode base than Fresh Fruits across the Final Dataset. Fresh Vegetables accounted for a greater share of total barcode activity and showed stronger movement in Continued from First Appearance items, indicating that more newer vegetable products were retained into the active assortment over time.
Both Fresh Fruits and Fresh Vegetables were still heavily anchored by Old barcodes, showing that the established range remained important across the full Fresh Produce category. However, Fresh Fruits were more stable and more dependent on retained core items, while Fresh Vegetables showed broader item activity, stronger lifecycle movement, and higher post-introduction retention.
4. Supplier performance was concentrated around the core range
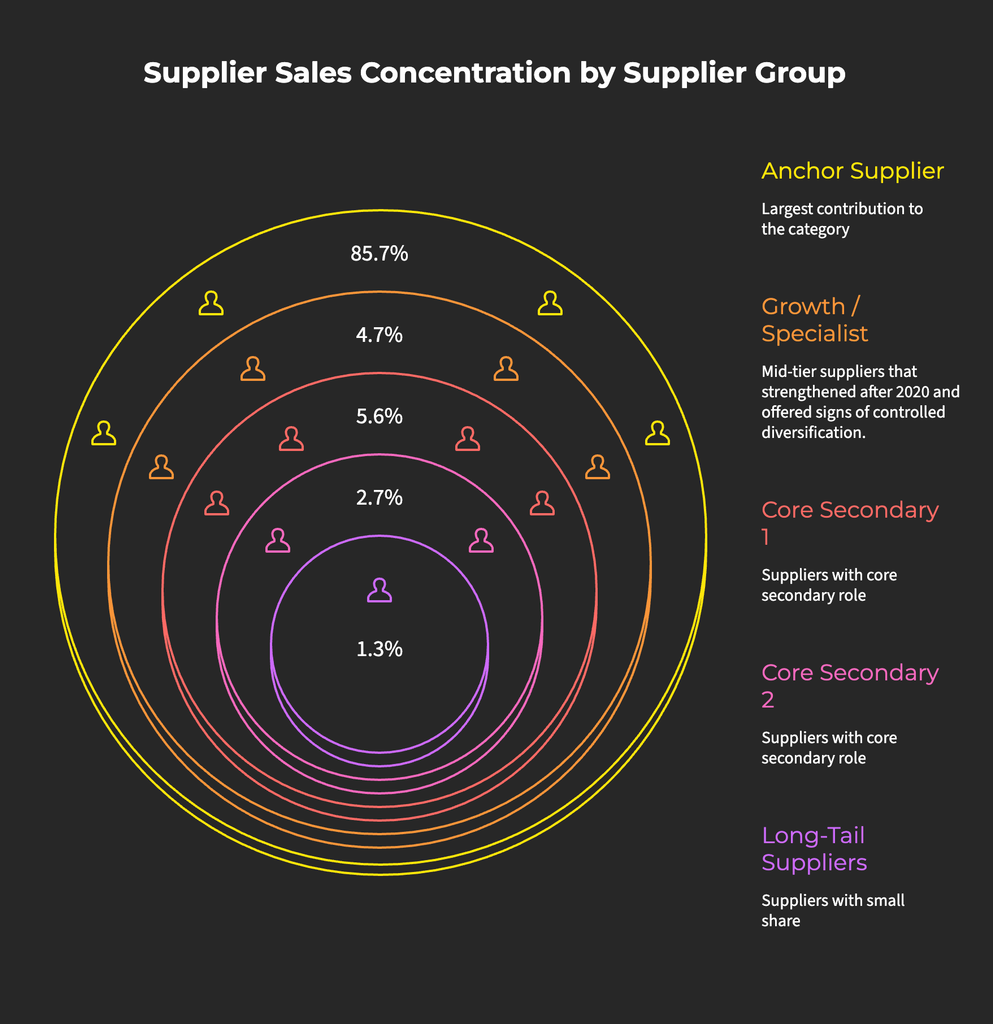
As shown in Figure 2: Supplier Sales Concentration by Supplier Group, supplier performance was highly concentrated around one Anchor Supplier, which accounted for approximately 85.7% of total category sales. The remaining sales contribution was split across Core Secondary Suppliers, Growth / Specialist Suppliers, and Long-Tail Suppliers, each contributing a much smaller share.
This shows that while the supplier base supported assortment breadth and flexibility, the category’s commercial value was still heavily dependent on one main supplier group. In other words, supplier diversity existed, but sales concentration remained high.
Figure 2: Supplier Sales Concentration by Supplier Group
Supplier names anonymised
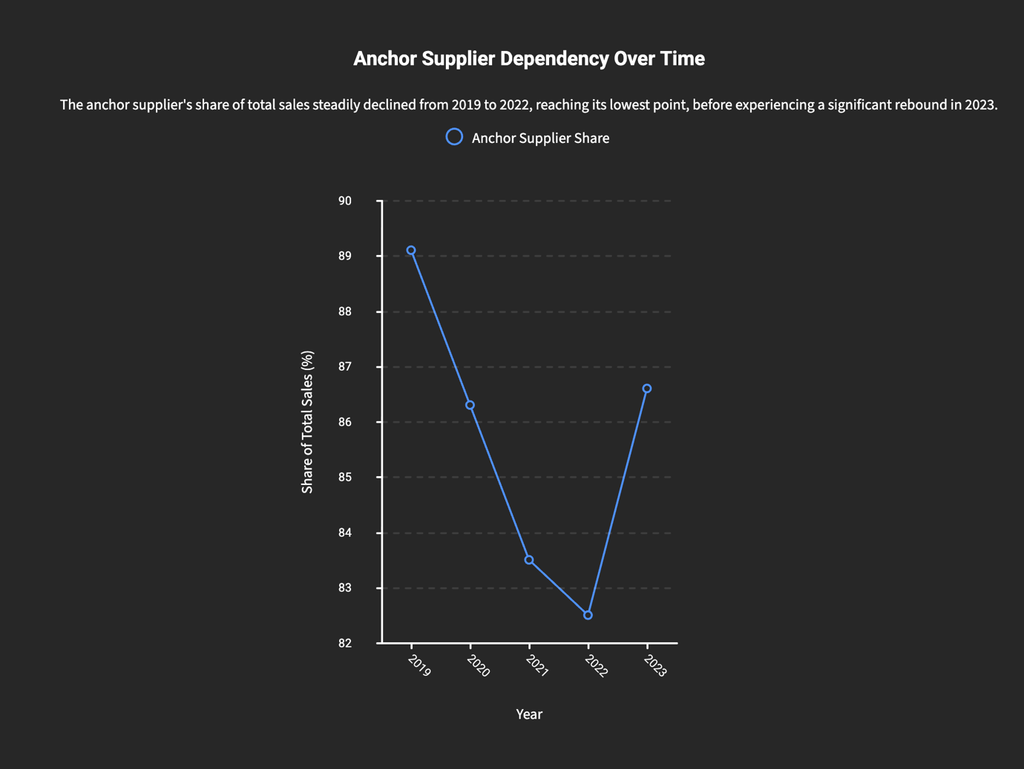
Figure 3: Anchor Supplier Dependency Over Time further shows that the Anchor Supplier consistently generated more than 80% of annual category sales across the 2019–2023 period. The share declined from 2019 to 2022, suggesting some temporary movement toward supplier diversification, but increased again in 2023. This indicates that supplier dependency remained a major feature of the category.
The supplier analysis also connects back to the barcode lifecycle findings. Supplier sales were mainly linked to Old barcodes rather than Actual New items, meaning supplier strength was driven more by support for the retained core range than by new-item launches.
This means supplier performance should not be judged only by the number of items supplied or the number of new launches introduced. A supplier with fewer items may still be commercially important if those items support the core range and generate meaningful sales. Similarly, a supplier with many low-performing new items may add assortment complexity without delivering strong commercial value.
Figure 3: Anchor Supplier Dependency Over Time
Based on Final Dataset, 2019–2023
5. Waste improved, but Fresh Fruits remained the priority family
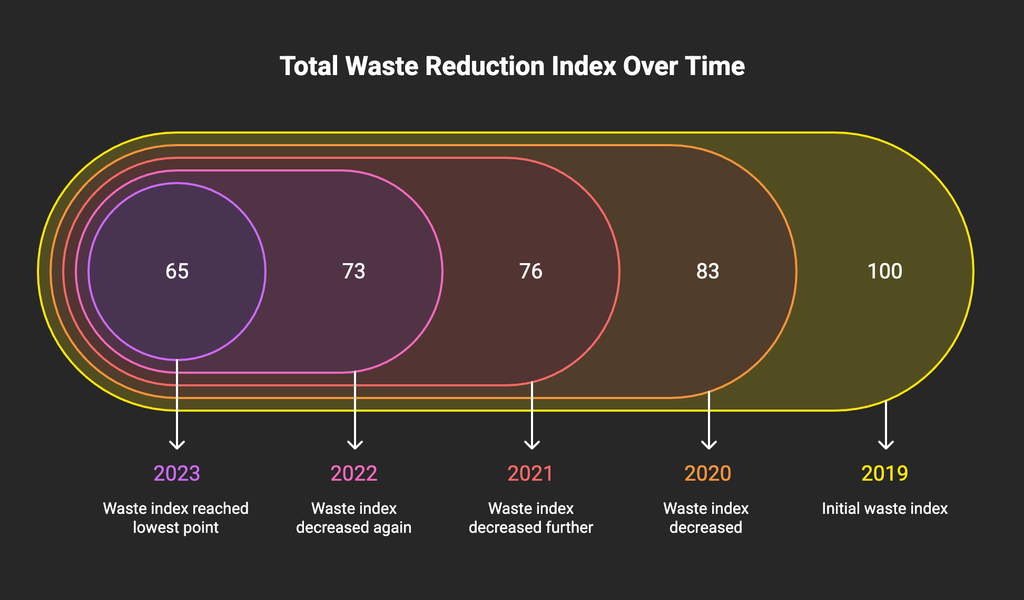
As shown in Figure 4: Waste Reduction Trend by Family Category, total waste reduced steadily across the 2019–2023 analysis period. The Waste Index moved from 100 in 2019 to 65 in 2023, indicating a clear improvement in waste control over time.
The chart also shows that Fresh Fruits remained the larger contributor to total waste throughout the period. In 2019, Fresh Fruits accounted for approximately 60.5% of total waste, compared with 39.5% for Fresh Vegetables. By 2023, Fresh Fruits represented approximately 65.6% of total waste, while Fresh Vegetables reduced to 34.4%.
This does not mean that Fresh Fruits waste worsened in absolute terms. Rather, the trend suggests that Fresh Vegetables improved faster, reducing their share of the remaining waste pool. As a result, Fresh Fruits became the larger priority area for further waste-reduction initiatives.
The supporting analysis windows reinforce this point. From 2020 to 2023, total waste reduced by approximately 21.5%, while from 2022 to 2023, waste reduced by approximately 10.5%. This shows that waste control improved across the category, but the remaining opportunity became increasingly concentrated around Fresh Fruits.
Figure 4: Waste Reduction Trend by Family Category

Based on Final Dataset, 2019–2023
6. Waste reduction should focus first on Old barcodes
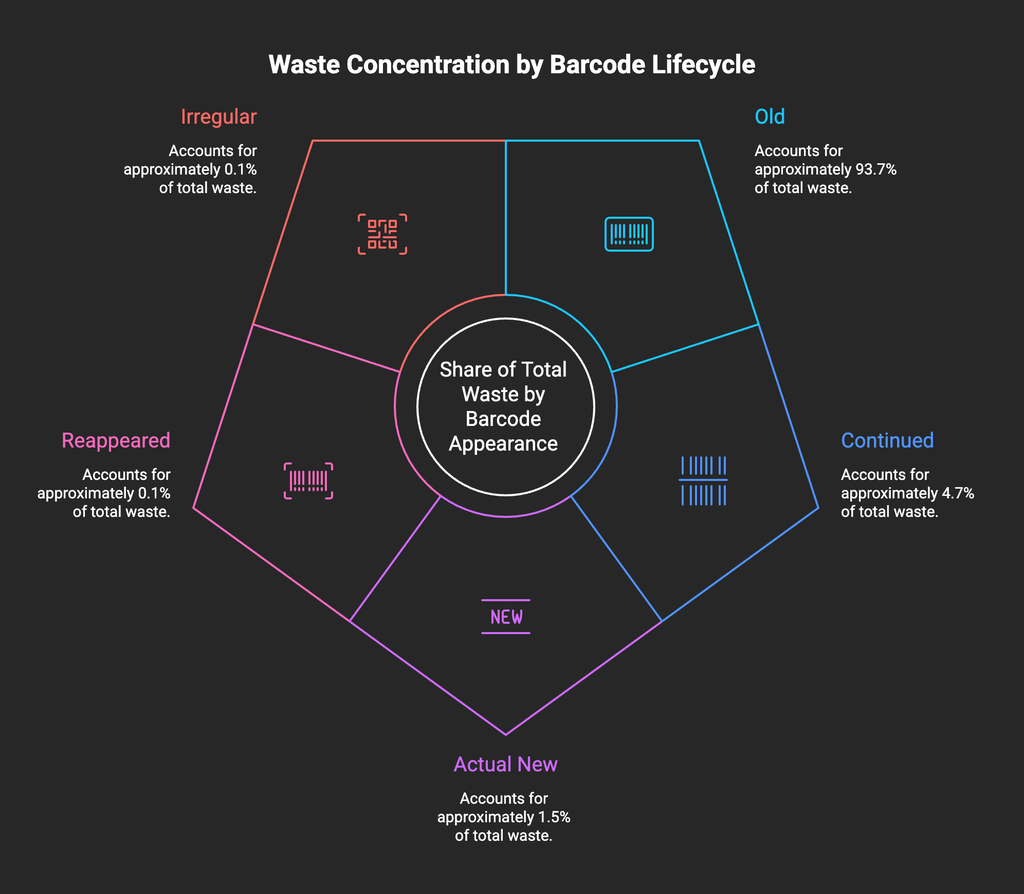
As shown in Figure 5: Waste Concentration by Barcode Lifecycle, waste was heavily concentrated in retained Old barcodes. In the Final Dataset, Old barcodes accounted for approximately 93.7% of total waste, making them the largest waste-contributing lifecycle group by a significant margin.
Figure 5: Waste Concentration by Barcode Lifecycle
Based on Final Dataset, 2019–2023
This finding is important because Old barcodes also formed the largest and most commercially active part of the assortment. Therefore, the high waste share is partly expected due to scale. However, it also means that the biggest operational impact will come from improving waste control within the retained core range.
The chart also shows that other lifecycle categories contributed a much smaller share of total waste. Continued from First Appearance accounted for approximately 4.7%, while Actual New, Reappeared, and Irregular barcodes together represented only a small portion of total waste. This confirms that waste reduction should not focus only on new launches or irregular items.
Because Old barcodes created both the largest sales base and the largest waste pool, the priority should be to review forecasting, ordering discipline, stock rotation, replenishment control, and range performance within the retained core assortment.
7. Retained newer items became a growing operational priority
As shown in Figure 6: Total Waste Reduction Index Over Time, overall waste improved steadily across the 2019–2023 analysis period, with the Waste Index moving from 100 in 2019 to 65 in 2023. This confirms that waste control improved across the Fresh Fruits and Fresh Vegetables category over time.
Figure 6: Total Waste Reduction Index Over Time
Based on Final Dataset, 2019–2023
However, the underlying barcode lifecycle analysis shows an important shift within that improvement. Continued from First Appearance items became more relevant from a waste perspective, with their share of total waste rising from approximately 1.8% in 2020 to 13.4% in 2023.
This suggests that selected newer items were no longer behaving like short-term launches. As they were retained and absorbed into the recurring assortment, they also became more operationally important. These items should therefore be managed like regular assortment lines, with ongoing monitoring of sales contribution, waste behaviour, supplier support, and replenishment settings.
8. Actual New items carried the highest waste-risk rate
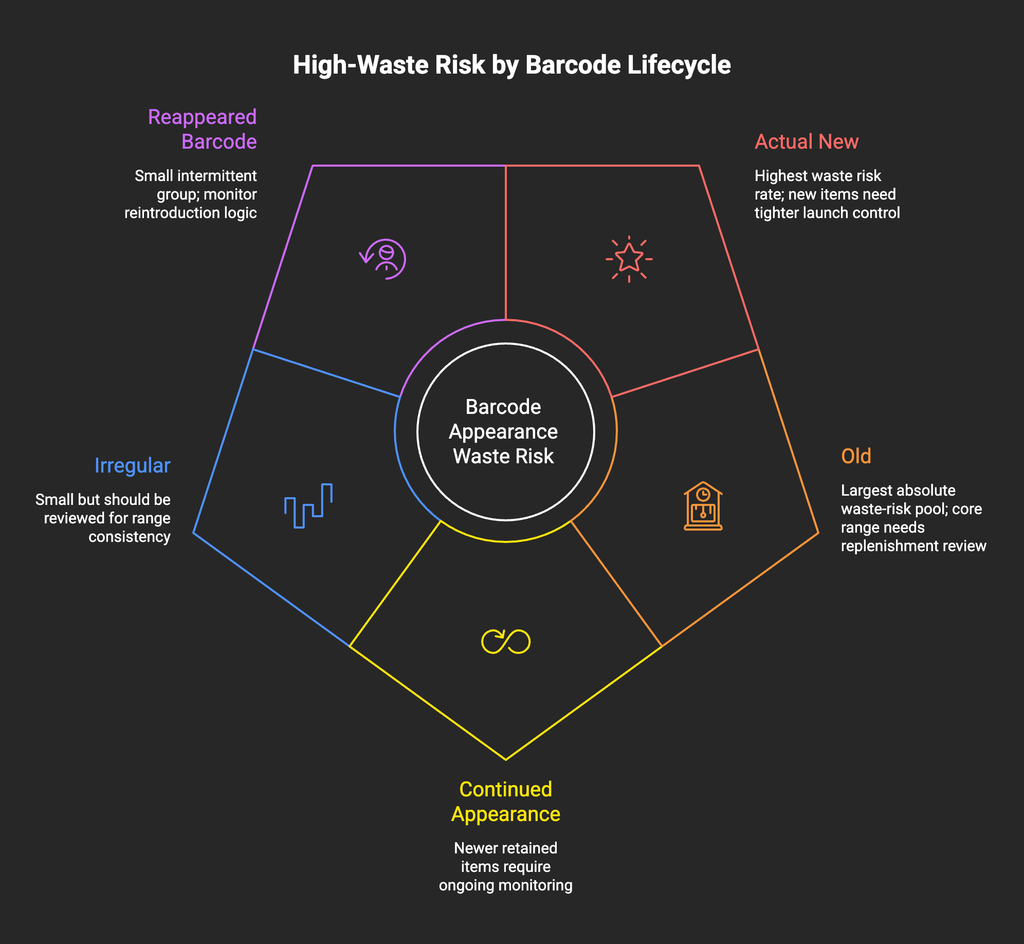
As shown in Figure 7: High-Waste Risk by Barcode Lifecycle, Actual New barcodes carried the highest waste-risk rate among the barcode lifecycle groups. In the Final Dataset, approximately 37.9% of Actual New barcodes fell into the High Waste category, making new-item introductions the riskiest group on a per-barcode basis.
This is important because Actual New items were not the largest waste contributor in absolute terms. Their total waste contribution was relatively small compared with Old barcodes. However, their higher risk rate suggests that new launches were more exposed to demand uncertainty, limited sales history, shorter performance windows, and potential over-ordering during introduction.
The supporting 2022–2023 analysis reinforces this finding, with Actual New barcodes showing a High Waste rate of approximately 40.7%. This confirms that launch-stage items require closer control, especially in a Fresh Produce context where perishability and uncertain demand can quickly create waste exposure.
The chart also shows that Old barcodes represented the largest absolute waste-risk pool, while Continued from First Appearance items required ongoing monitoring as they became part of the recurring assortment.
Therefore, Actual New items should be managed with tighter launch controls, smaller trial quantities, early sales monitoring, and faster discontinue-or-scale decisions.
Figure 7: High-Waste Risk by Barcode Lifecycle
Based on Final Dataset, 2019–2023
9. The Waste Risk Matrix exposed barcode-level fragmentation
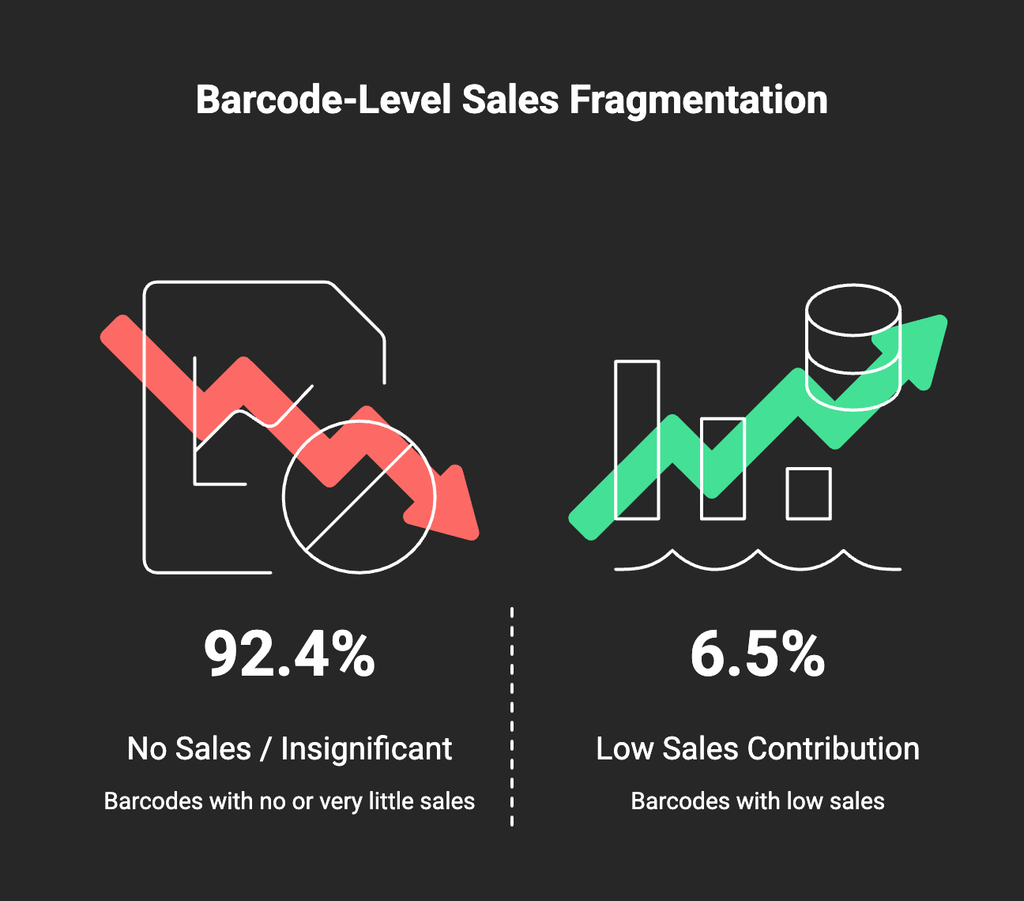
As shown in Figure 8: Barcode-Level Sales Fragmentation, most barcode activity sat within the No Sales / Insignificant and Low Sales Contribution bands. Approximately 92.4% of barcodes fell into the No Sales / Insignificant category, while a further 6.5% fell into the Low Sales Contribution category.
This reflects the fragmented nature of Fresh Fruits and Fresh Vegetables at barcode level. In Fresh Produce, sales are often spread across many SKUs, origins, pack sizes, seasonal variations, and product types. As a result, many individual barcodes may contribute only a small share of total category sales.
This is why the Waste Risk Matrix is useful. It does not only show which items create waste; it helps identify where waste is occurring without proportionate sales contribution. Barcodes with low or insignificant sales but medium or high waste exposure should therefore be prioritised for ordering adjustment, range review, waste-control action, or rationalisation.
Figure 8: Barcode-Level Sales Fragmentation
Based on Sales Contribution Band analysis
Overall Analysis Summary
Across all analysis windows, the Fresh Fruits and Vegetables category shows a clear movement from assortment expansion toward assortment stabilisation. Old barcodes remained the commercial backbone of the category and generated the majority of sales, while selected newer items were retained and gradually absorbed into the recurring range.
Fresh Vegetables showed stronger assortment movement than Fresh Fruits, with more retained newer items and greater lifecycle evolution. Fresh Fruits, however, remained more dependent on the old/core range and continued to represent the larger share of waste.
Supplier performance was highly concentrated. One Anchor Supplier consistently drove the majority of commercial value, while secondary, specialist, emerging, and long-tail suppliers supported assortment breadth, variety, and flexibility. This shows that supplier performance should not be judged only by item activity, but also by commercial contribution and support for the core range.
Waste reduced over time across the category, but the largest waste opportunity remained within Old barcodes because of their scale. Actual New items carried the highest waste-risk rate, meaning they require stronger launch controls, while Old barcodes require replenishment, forecasting, and operational waste-control review.
Overall, the analysis demonstrates how barcode-level retail analysis can help identify assortment stability, supplier dependency, sales concentration, category movement, and waste-risk priorities within F&V.
Data-Led Recommendation Areas
Based on the barcode-level analysis, several recommendation areas can be identified to support Fresh Produce assortment optimisation, supplier review, and waste reduction. These recommendations are indicative and would need to be validated with store operations, buying teams, supplier agreements, and replenishment practices before implementation.
1. Core Range Waste-Control Framework
Old barcodes formed the largest share of barcode activity, generated the majority of sales, and accounted for the largest share of total waste. Fresh Fruits also remained the larger contributor to remaining waste. Therefore, the first recommendation is to introduce a focused Core Range Waste-Control Framework for retained Old barcodes, especially within Fresh Fruits.
This framework should review whether FIFO/FEFO practices, stock rotation, quality-based inspection, replenishment settings, and ordering discipline are being applied consistently across high-waste core items. For Fresh Produce, this is important because waste is influenced not only by age of stock, but also by product quality, seasonality, ripeness, customer preference, and demand variation.
The aim is not only to reduce waste, but to protect sales by ensuring that commercially important core items remain available, fresh, and presentable.
2. New Item Launch and Retention Control Framework
Actual New items carried the highest waste-risk rate on a per-barcode basis, while Continued from First Appearance items became more important over time. This means new products should not be launched casually, and retained newer items should not be left unmanaged after launch.
The recommendation is to create a New Item Launch and Retention Control Framework supported by seasonal catchment and market analysis. This can include customer preference checks, local demand review, seasonal product planning, competitor observation, and short surveys or feedback collection where practical.
New items should be introduced with smaller trial quantities, defined review periods, early sales and waste monitoring, and clear scale-or-discontinue decisions. If a new item is retained and becomes a Continued from First Appearance item, it should move into the regular assortment review cycle with monitoring for sales contribution, waste behaviour, supplier reliability, and replenishment settings.
3. Supplier Performance and Dependency Review
Supplier sales were highly concentrated around one Anchor Supplier, while other supplier groups supported assortment breadth and flexibility. This creates a need to review supplier performance beyond item count alone.
The recommendation is to introduce a Supplier Performance and Dependency Review using supplier scorecards, periodic supplier reviews, operational checklists, and the Waste Risk Matrix. Supplier performance should be assessed using commercial contribution, support for core-range items, waste behaviour, reliability, responsiveness, and ability to support selected retained or seasonal items.
This does not mean immediately replacing the Anchor Supplier or vertically integrating. A more practical first step is to identify which secondary suppliers are commercially meaningful, which suppliers contribute to high-waste items, and whether supplier dependency creates operational or commercial risk.
Key Findings
Conclusion
The analysis demonstrates that the Fresh Fruits and Vegetables category evolved from a period of broader assortment expansion toward a more stable and commercially anchored range. Old barcodes remained the dominant part of barcode activity, generated the majority of sales, and accounted for the largest share of total waste. This confirms that the retained core assortment was both the main commercial engine of the category and the largest operational improvement opportunity.
At the same time, the category was not static. Continued from First Appearance items became more important over time, showing that selected new products were successfully retained and absorbed into the recurring assortment. Actual New items, however, carried the highest waste-risk rate on a per-barcode basis, indicating that new-item launches require closer control, smaller trial quantities, early performance monitoring, and clearer scale-or-discontinue decisions.
The family-level findings further show that Fresh Vegetables had stronger assortment movement, while Fresh Fruits remained more dependent on the retained core range and continued to represent the larger share of remaining waste. This indicates that waste-reduction activity should not be applied broadly across the category in the same way. Instead, it should be prioritised through a focused Core Range Waste-Control Framework, especially for high-waste Old barcodes and Fresh Fruits items, supported by reviews of FIFO/FEFO practices, quality-based inspection, stock rotation, replenishment settings, and ordering discipline.
Supplier analysis also reinforces the need for more structured category management. The category remained highly dependent on one Anchor Supplier for commercial value, even though other supplier groups supported assortment breadth and flexibility. This does not immediately suggest replacing the Anchor Supplier or pursuing major strategic changes such as vertical integration. A more practical first step is to introduce a Supplier Performance and Dependency Review using scorecards, periodic supplier reviews, operational checklists, and the Waste Risk Matrix to assess supplier contribution, reliability, waste behaviour, and dependency risk.
Overall, the report shows that barcode-level retail analysis provides a practical and action-oriented way to manage Fresh Produce performance. By linking assortment lifecycle, sales contribution, supplier dependency, and waste-risk behaviour, the analysis identifies where the category is commercially strong, where it is operationally exposed, and where management action should be prioritised. The key conclusion is that Fresh Produce optimisation should focus less on broad range expansion and more on protecting the core assortment, reducing waste in high-scale retained items, managing new launches through structured controls, and strengthening supplier performance around commercially meaningful products.
Improve Your Retail Procurement Strategy
Make better assortment, supplier, and inventory decisions with structured retail procurement support.